Europe's Startup Scoreboard: What the Data Really Says About Ireland, France — and the Gap Between Them

Europe's first Startup & Scaleup Scoreboard reveals a surprising reality: Ireland and France rank side by side among Europe's top innovators, yet rely on radically different models. What can each ecosystem learn from the other?
Introduction: Four reports, one picture
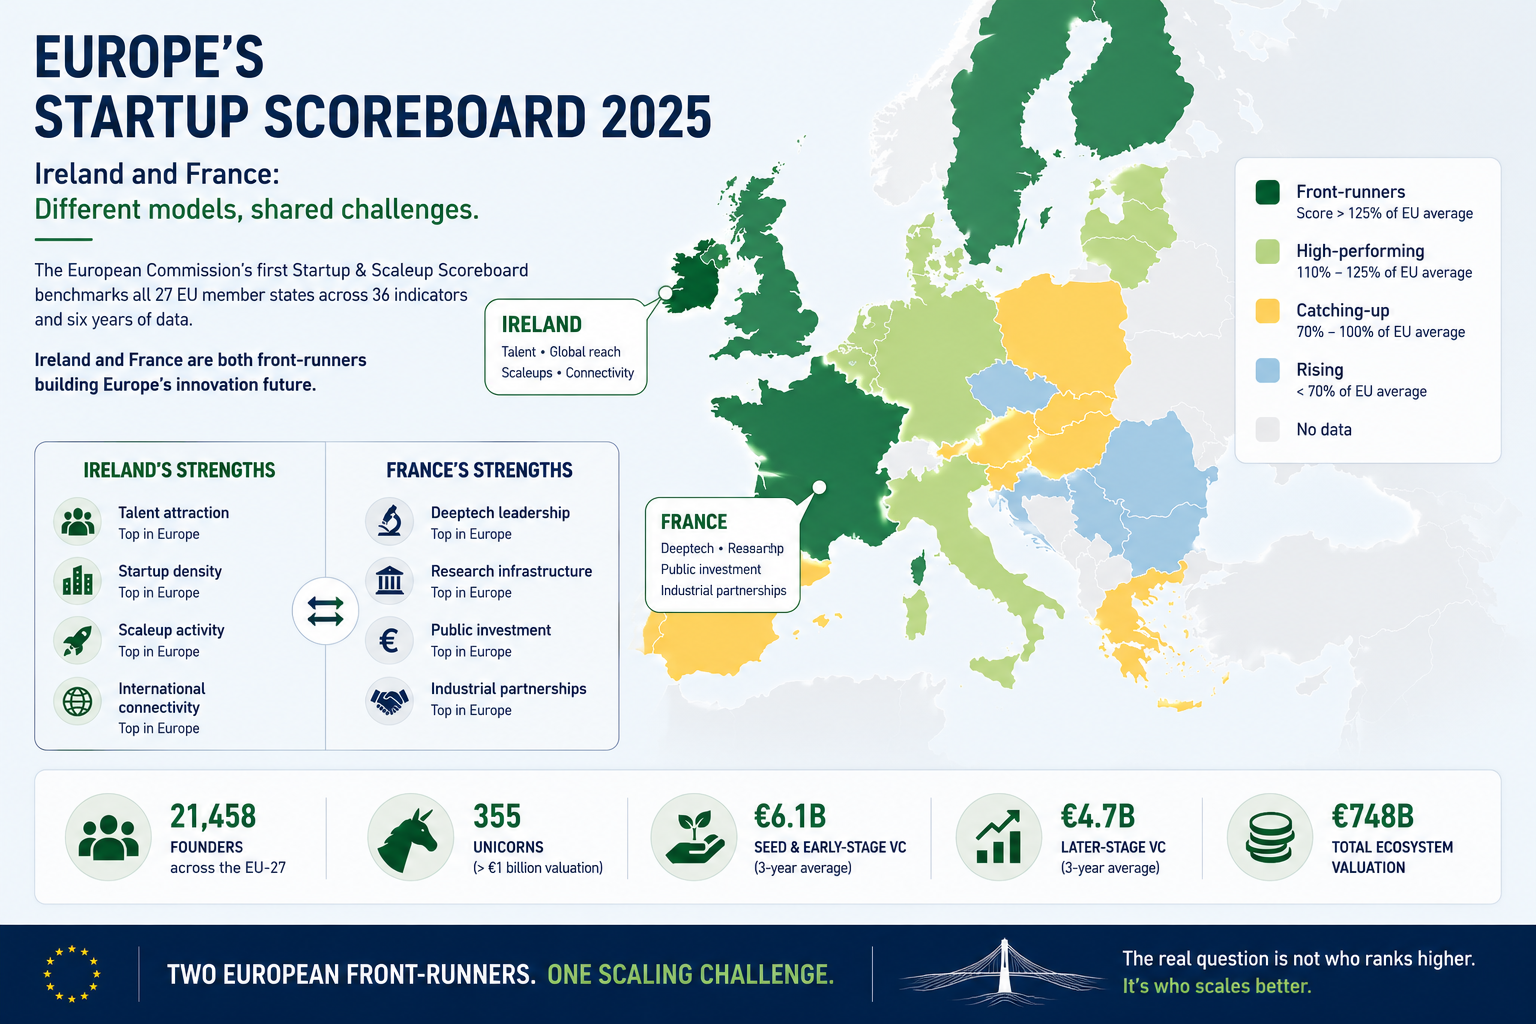
The European Commission has just published the first-ever European Startup and Scaleup Scoreboard (ESS) — a landmark exercise in measurement that benchmarks the startup and scaleup ecosystems of all 27 EU member states across 36 indicators and six years of data. It is, in short, the most rigorous attempt yet to answer a deceptively simple question: which European countries are actually building the best environments for innovation-driven companies, and is the gap widening or closing?
From my desk in Dublin, three other publications landed at the same time. TechIreland's Irish Startup Funding Review 2026, backed by Enterprise Ireland, gives a granular picture of where Irish startup capital actually went in 2025. The Panorama de l'écosystème French Tech 2025, published by the French government's own Mission French Tech, offers a structural view of France's 18,000 active startups that goes well beyond funding headlines. And EY's annual Barometer of Venture Capital in France closes the loop on the French financing picture.
Together, these four sources produce something the Scoreboard alone cannot: a cross-validated, dual-country picture of what it actually means to be a front-runner European startup ecosystem in 2025 — warts and all.
Ireland ranks 7th in Europe. France ranks 8th. They sit in the same performance group. And yet their profiles could hardly be more different. Understanding that difference matters — not just for policymakers, but for any founder, investor or innovation professional operating across the two ecosystems.
Part I: Europe's innovation trajectory — strong progress, but the gap with the US is not closing
The headline is genuinely good
The EU-27's composite Startup and Scaleup Index rose by 13.5 percentage points between 2020 and 2025 (from a base of 100 to 113.5). That is not trivial. The EU ecosystem grew through a global venture capital contraction in 2024 — when the index dipped to 110.9 — and recovered. The structural trend is upward.
The key figures published by the Commission for 2025:
- 21,458 founders counted across the EU-27
- 355 unicorns (companies valued above €1 billion)
- €6.1 billion in seed and early-stage VC investment (3-year average)
- €4.7 billion in later-stage VC investment (3-year average)
- €748 billion in total ecosystem valuations
These are not negligible numbers. But they need context.
The less comfortable context
Global venture capital reached $435 billion in 2025 — up 27%. The United States captured $276 billion of that, a 43% increase, representing 63% of the world total. Europe managed 15%. AI now accounts for 25% of all global VC activity, up from 14% the year before — and the overwhelming majority of those AI dollars are flowing to US labs.
To put it plainly: all of Europe's startup ecosystem is worth roughly what the US raises in venture capital in a single year. That ratio has not materially changed since 2020. The EU ecosystem is growing, but so is the gap with its primary competitors. This is the context in which the Draghi report's call for a sovereign European innovation agenda should be read — and it is the context in which this Scoreboard will, hopefully, become a genuine policy tool rather than just a league table.
Part II: The European map — a four-speed continent
The 2025 ranking
The Scoreboard divides the 27 member states into four performance groups based on their SSI score relative to the EU average:
Front-runners (8 countries, score > 125% of EU average): Estonia (160.4%), Sweden (158.9%), Finland (155.7%), Netherlands (155.3%), Denmark (148.2%), Luxembourg (148.0%), Ireland (132.6%) and France (127.3%).
High-performing (6 countries, 110–125%): Belgium (124.8%), Austria (113.8%), Cyprus (111.0%), Malta (110.5%), Lithuania (105.5%), Germany (101.8%).
Catching-up (8 countries, 70–100%): Portugal (96.2%) through Poland (71.6%).
Rising (5 countries, below 70%): Greece (69.8%) through Romania (46.1%).
The trajectories matter more than the snapshot
Over the 2020–2025 period, the five most improved countries are Finland (+26.6 points), France (+26.5 points), Lithuania (+24.8 points), Ireland (+20.3 points) and Estonia (+18.4 points). The gap between Finland and France is statistically negligible at 0.07 points.
But there is a more important story in the sub-dimension trends at EU level. Three structural dimensions have actually regressed since 2020 at the European aggregate: innovation-friendly regulation (-3.6 points), access to infrastructure (-1.3 points), and — most worrying of all — economic impacts (-5.9 points). That last figure means that despite more money, more companies and higher valuations, the measured economic impact of those companies (SME value added, jobs in young high-growth firms) is declining relative to 2020. This is the statistical signature of Europe's "scaling gap" — the inability to turn promising startups into mass-employment industrial champions.
Part III: Ireland — a remarkable outlier, with a structural Achilles heel
The numbers behind the 7th-place ranking
Ireland's SSI score of 132.6% of the EU average in 2025 places it 7th in Europe — firmly in the Front-runner group, just above France. Its trajectory has been consistent and uninterrupted: 130.2 in 2020, rising every single year to 150.4 in 2025 (on the base-year scale). Even in 2024, when most other countries contracted, Ireland continued to improve.
The picture across the 36 individual indicators is striking in its consistency. Ireland scores above 125% of the EU average on exactly 18 of the 36 indicators — half of them. Its first-place rankings tell a specific story:
- 1st in Europe — ease of establishing a startup (141% of EU average)
- 1st in Europe — number of startups per million inhabitants (194%)
- 1st in Europe — number of scaleups per million inhabitants (415%)
- 1st in Europe — number of unicorns per million inhabitants (409%)
- 1st in Europe — overall startup and scaleup ecosystem impacts (210%)
These five first places are not a coincidence — they are the compound result of decades of policy decisions: a low corporate tax environment, sustained investment in higher education, a deliberate strategy of attracting global technology multinationals, and a relatively flexible labour market with strong immigration of skilled workers. Ireland's share of foreign-born workers with tertiary education among employed people ranks 2nd in Europe at 236% of the EU average — the talent pipeline from abroad is exceptional.
The numbers further down the ranking are equally telling:
- 2nd — value added per person employed in SMEs (253.7% — Irish SMEs that do exist are highly productive)
- 4th — employment share in young high-growth enterprises (271.9%)
- 4th — number of exits per million inhabitants (275.2%)
- 5th — number of founders per million inhabitants (244.6%)
This is not an ecosystem that merely creates companies — it creates companies that grow, generate exits, and produce meaningful employment. That is genuinely rare in Europe.
The structural weakness the Scoreboard reveals
And yet Ireland ranks 27th out of 27 for international competitiveness of SMEs (61.6% of EU average). Last place. It ranks 26th for product exports by SMEs (10.7%) and 26th for services exports (19.2%). It scores zero on insurance and pension fund VC commitments — a complete absence of domestic institutional capital. It ranks 17th for public sector innovation spending (63.2%) and 18th for participation in European research infrastructures (57.0%).
These rankings are not errors. They reveal the fundamental tension at the heart of the Irish innovation model: the ecosystem performs brilliantly on metrics driven by multinational activity and international capital, and relatively poorly on metrics that require indigenous Irish companies to internationalise and scale under their own steam. The Ireland that ranks 1st for unicorns per capita is largely the Ireland that houses the European headquarters of companies founded elsewhere. The Ireland that ranks 27th for SME competitiveness is the Ireland where locally-founded companies are trying to grow without the benefit of that multinational scaffolding.
TechIreland confirms the ground-level picture
The TechIreland Irish Startup Funding Review 2026 translates the abstract Scoreboard metrics into concrete market reality.
In 2025, 319 Irish companies raised a total of €992 million — broadly flat since 2022, and well below the 2021 peak of €1.6 billion. The concentration is striking: just four deals accounted for 46% of the total: LetsGetChecked (€150M), XOcean (€115M), Tines (€114M), ProVerum (€73M). Remove those four, and you are left with 315 companies splitting roughly €530 million — a very different picture.
Q1 2025 was, by TechIreland's reckoning, the best quarter for Irish startup fundraising in ten years: 69 companies, €616 million. The three subsequent quarters produced a combined €376 million. That Q1 front-loading — probably reflecting deals initiated in late 2024 that closed in January and February — makes the annual headline figure look healthier than the underlying flow.
The scaling gap is measured precisely in the TechIreland data. Rounds in the €3–10M range increased marginally from 24 to 25 deals, against a historical average of 30–40. The amount raised in those rounds fell from €153M to €113M. Series A+ rounds (€5M–€30M) are at pre-2019 levels. These are the companies that have validated their model but are not yet large enough to attract the big international growth funds — the valley of death that the Scoreboard's 27th place on SME competitiveness captures at a macro level.
Enterprise Ireland is playing an explicitly counter-cyclical role: 198 startups supported, €32.9M through Pre-Seed Start Fund and HPSU instruments, €80M through VC scheme co-investments, €50M in direct equity leveraging a total of €440M. Without that state intervention, the early-stage pipeline would look considerably thinner. A record 211 companies raised sub-€1M rounds in 2025 — almost entirely attributable to Enterprise Ireland support.
Geographically, Dublin accounts for 60% of companies and 67% of investment value. The regions raised €210M. Louth topped the regional rankings — but only because XOcean's €115M round is Louth's postcode. Cork, with 21 companies and just €5M raised, illustrates both the vibrancy and the underfunding of regional entrepreneurship.
Sectorally, Life Sciences took over 50% of total investment (LetsGetChecked, ProVerum, Deciphex, Perfuze). This sector concentration explains Ireland's exceptional scores on "Impacts" in the ESS Scoreboard. Energy and CleanTech, however, collapsed from €328M in 2024 to just €41M — an 87% decline in a single year, which goes well beyond any global trend and raises questions about the pipeline of climate-focused companies coming through the system.
Dublin ranks 9th among Europe's Global Champions (and 40th globally) in Dealroom's Global Tech Ecosystem Index 2026 — external validation of the ecosystem's international standing, despite its domestic tensions.
Part IV: France — institutional firepower, but a stubborn delivery gap
A score built on public infrastructure
France's SSI score of 127.3% of the EU average in 2025 places it 8th in Europe — the same Front-runner group as Ireland, one rank behind. Its trajectory mirrors Ireland's in consistency, if slightly lower in absolute terms: 118.0 in 2020, rising annually to 144.5 in 2025 (base-year scale).
France's first-place rankings in the Scoreboard reveal the architecture of its model immediately:
- 1st in Europe — insurance and pension fund VC commitments (236.1% of EU average)
- 1st in Europe — public sector innovation spending (183.6%)
- 2nd — participation in European research infrastructures (207.3%)
- 2nd — direct government funding and tax support for business R&D (230.8%)
- 3rd — later-stage VC investments as % of GDP (161.0%)
- 3rd — government VC fund commitments (163.7%)
- 3rd — innovation procurement spending (134.7%)
This is a very specific profile: France's top-ranked indicators are almost entirely about the supply of public capital and public research infrastructure. It is the ecosystem that France 2030, BPIFrance, PIA, the CEA, INRIA, CNRS and CNES have built over decades. On these metrics, France is not just a leader — it is setting a standard that most EU countries cannot match.
The delivery gap: where the results don't match the investment
And then you look at the output-side indicators, and the picture shifts substantially:
- 27th (last) in Europe — value added by SMEs as a share of GDP (3.6% of EU average)
- 26th — employment share of young high-growth enterprises (34.4%)
- 25th — product exports by SMEs (24.1%)
- 24th — service exports by SMEs (61.9%)
- 22nd — entrepreneur satisfaction with the business environment (92.3%)
- 26th — economic impacts sub-dimension (55.8%)
The 27th-place ranking on SME value added is perhaps the most startling figure in the entire French dataset. It means that French SMEs contribute proportionally far less to the national economy than their European counterparts — despite France ranking 1st in public innovation spending. The "grands projets" logic of French industrial policy produces world-class research institutions and a handful of well-funded champions, but has historically struggled to diffuse economic value across the broader SME population.
This is the quantitative expression of what practitioners call the "pépite paradox": France grows outstanding deep technology companies, funds them generously with public money, and then watches them underperform on jobs, exports, and economic value added. The Scoreboard's "Economic impacts" sub-dimension places France 26th out of 27 — ahead only of Romania.
The Panorama French Tech: the structural picture beyond the funding headlines
The Panorama de l'écosystème French Tech 2025, published by the French government's Mission French Tech, offers a richer picture of the French ecosystem that EY's funding barometer alone cannot provide.
The employment figures are substantial: 450,000 direct jobs generated by French startups, growing at +4.6% in the first half of 2025. The FT120/Next40 companies alone employ 45,000 people. These are absolute numbers that the normalised Scoreboard indicators tend to understate for a country of France's size.
The geographic distribution is shifting: 56% of French startups now operate outside Île-de-France. Regions account for 57% of seed-stage deals. Auvergne-Rhône-Alpes and Occitanie are emerging as significant poles, each accounting for over 10% of regional seed activity. But the scaling capital remains stubbornly Parisian: 64% of Series C+ rounds stay in Île-de-France, and the Paris region captured 72% of total investment value between January and September 2025.
The AI territorial fracture is particularly instructive: 44% of French AI startups are born outside Île-de-France, supported by nine regional clusters (SequoIA in Rennes, MIAI in Grenoble, ANITI in Toulouse, 3IA Côte d'Azur, and others). But only 7% of AI funding flows to the regions — 93% stays in Paris. The 1,917 French AI startups employ over 50,000 people, but their financing is structurally Parisian.
France's deeptech — 1,275 startups, 28,030 employees, 66% located outside Île-de-France — is anchored in the country's exceptional public research tissue: quantum computing, space, cybersecurity, biotech. These companies cluster around the CEA, INRIA, CNRS, and CNES — exactly the institutions that earn France its 2nd-place ranking in European research infrastructure participation.
EY's 2025 annual barometer documents the financing picture: €7.39 billion raised (–5%, 618 operations). But strip out Mistral AI's €1.7 billion raise — 23% of the national total on its own — and the underlying market contracted by 26%. Software leads at €3.3 billion (+9%, driven by generative and agentic AI). Life Sciences rebounds strongly at €975M (+20%). Greentech falls sharply to €1 billion (–46%). Fintech drops to €543M (–35%).
One genuinely encouraging signal: the links between CAC40 companies and French startups have multiplied tenfold in four years, with the French startup share of those partnerships rising from 45% to 71% between 2021 and 2025. This progressive integration into major industrial group supply chains is what should, over time, begin to reduce the gap between funding intensity and measurable economic impact. It is a lagging indicator — but it is moving in the right direction.
Part V: Ireland and France side by side — two models, one ranking group
The full sub-dimension comparison
This table encapsulates the fundamental asymmetry. On the two impact dimensions — overall impacts and economic impacts — Ireland ranks 1st and 2nd while France ranks 14th and 26th. On the structural dimensions — public expenditure, finance, framework conditions — France dominates. Ireland scores poorly where France excels, and vice versa with remarkable consistency.
The reading of this is not that one model is superior. It is that France builds the foundations, Ireland harvests the results — at least as measured by these indicators. France's public investment cycle is long: research infrastructure, PIA programmes and BPIFrance instruments take years to translate into employment and value-added statistics. But the persistence of this delivery gap across five years is a policy signal that something in the translation mechanism is not working as efficiently as intended.
The five starkest contrasts
Looking at individual indicators where the gap between the two countries exceeds 150 percentage points:
Ireland leads France by the largest margins on: number of VC-backed companies per million inhabitants (442% vs 97%, gap of 345pp), number of unicorns per million (409% vs 107%, gap of 302pp), number of scaleups per million (415% vs 145%, gap of 270pp), employment in young high-growth enterprises (272% vs 34%, gap of 238pp).
France leads Ireland by the largest margins on: insurance and pension VC fund commitments (236% vs 0%, gap of 236pp — Ireland has none), participation in European research infrastructures (207% vs 57%, gap of 150pp), government VC fund commitments (164% vs 31%, gap of 133pp), local VC funds as % of GDP (172% vs 45%, gap of 127pp).
These are not accidents. They are the systematic expression of two very different policy philosophies about how ecosystems get built — and what "success" looks like.
Part VI: The shared vulnerabilities
Despite their structural differences, the data reveals three weaknesses that France and Ireland hold in common — which makes them more actionable as policy targets.
1. Dependence on mega-deals
In France, Mistral AI's €1.7 billion raise accounts for 23% of the national total. In Ireland, four companies account for 46% of €992M. In both cases, a shock to those headline transactions causes the annual aggregate to collapse — which is precisely what happened in France's 2024 underlying figures and in Ireland's Q2–Q4 2025 performance.
This concentration is a symptom, not a cause. The cause is an underdeveloped Series A/B market (€3M–€30M rounds) in both countries. TechIreland documents the Irish version precisely: sub-€10M rounds declining below historical averages. The Panorama French Tech reveals the French version through the regional-to-Parisian funding funnel: abundant seed activity in the regions, almost no Series C+ outside Paris. Both countries are better at starting companies than scaling them through the critical intermediate growth phase.
2. Geographic concentration
Dublin concentrates 67% of Irish investment value. Paris concentrates 72% of French investment value. Both countries have strong regional entrepreneurial activity — 319 Irish funding events are spread across 25 counties; 56% of French startups operate outside Île-de-France. But the capital follows a different geography from the companies.
This is more than a fairness problem. It is a market efficiency problem: promising companies in Cork, Galway, Lyon or Bordeaux are systematically underfunded relative to their quality, not because of their merit but because they are outside the investor networks. Both Enterprise Ireland and the Mission French Tech recognise this explicitly — but correcting it requires more than programme announcements.
3. SME export weakness
Ireland ranks 26th, France 25th in Europe for product exports by SMEs. These are two of the continent's best-performing startup ecosystems, sitting near the bottom on one of the most fundamental measures of commercial internationalisation. The Scoreboard's "International competitiveness" sub-dimension places Ireland 27th (61.6%) and France 17th (87.9%) — both below the EU average.
For Ireland, the explanation lies partly in the multinational dependency discussed earlier: Ireland's trade statistics are dominated by large foreign-owned companies, while indigenous SMEs have a more limited international footprint. For France, it connects to the broader "pépite paradox" — technology excellence that does not efficiently convert into commercial scale.
Part VII: The Franco-Irish opportunity
Complementarity, not competition
Reading the ESS profiles of France and Ireland together, the obvious conclusion is that these two ecosystems are more complementary than competitive — and that the complementarity is more structured than usually appreciated.
France brings deep public research infrastructure, distributed deeptech (66% of deep tech startups outside Paris), institutional financing instruments, and a 1st-place ranking in public innovation spending. Ireland brings startup density (1st in Europe), international talent attraction (2nd), proximity to anglophone markets, and the operational infrastructure of some of the world's most sophisticated technology companies.
The MoU signed between Bull and Equal1 on 14 April 2026 is a concrete example of this complementarity in action: it connects Bull's HPC infrastructure and Qaptiva software stack with Equal1's rack-mounted silicon-spin quantum servers, building a hybrid quantum-classical integration pathway for European data centre environments. Separately but complementarily, Ireland's position within the European AI Factories strategy creates a direct institutional link with France: the Irish AI Factory Antenna — co-hosted by the University of Galway and ICHEC — has designated AI2F, the French AI Factory led by GENCI and Inria, as its priority partner. Alice & Bob's €100M Series B raise in January 2025 — a Paris-based quantum computing startup spun out of the Inria Paris/ENS-PSL QUANTIC research team — represents exactly the kind of French deeptech company that Ireland's international networks could help accelerate toward anglophone markets. NVIDIA's NVentures arm invested in Alice & Bob in May 2026, a further signal of growing international recognition for French quantum research.
In Life Sciences, the convergence is already natural: Life Sciences dominates Irish startup funding (over 50%) and is rebounding strongly in France (+20% in 2025). The biotech clusters around Paris-Saclay, Lyon and Bordeaux connect naturally with Ireland's medtech and pharma infrastructure and IDA's multinational networks.
French Tech Dublin as the interface
The Panorama French Tech counts 66 internationally-labelled communities in 52 countries. French Tech Dublin — officially relabelled as a French Tech Community for 2026–2028 — is the institutional interface between France's 18,000 active startups and Ireland's exceptionally dense entrepreneurial ecosystem. This network is not a substitute for investment funds or government programmes, but it creates the information flows and relationship infrastructure that allow capital and talent to move more efficiently between the two ecosystems.
In a context where both countries share the same vulnerability on scaling capital, and where the European Scoreboard has just produced the first common measurement framework, this bilateral interface has more strategic utility than at any previous point.
Conclusion: Two front-runners, one challenge
The European Startup and Scaleup Scoreboard is a genuinely useful addition to the European policy toolkit. For the first time, it provides a consistent, multi-year, multi-indicator benchmark that allows meaningful comparison across all 27 member states — and, just as importantly, tracks whether policies are working or not.
For Ireland and France, ranked 7th and 8th and separated by a single position, the Scoreboard confirms what practitioners already suspected: two front-runner ecosystems, built on fundamentally different models, sharing the same fundamental weakness — the inability to systematically scale promising companies through the critical intermediate growth phase.
Ireland builds world-class entrepreneurial density from global talent and multinational spillovers, but struggles to grow indigenous SMEs into international exporters. France builds world-class research infrastructure and public financing architecture, but struggles to convert that investment into economic impact at scale.
The policy implication is not that one country should copy the other — it is that each country has something the other needs. And in a world where the US is growing its innovation lead, where AI is concentrating capital at the top of the market, and where climate technology is being defunded by private investors just when it is most needed, the case for structured Franco-Irish cooperation on innovation is stronger than it has ever been.
The Scoreboard gives us a common language. The data gives us a roadmap. Now comes the harder part.
Sources and methodology
European Startup and Scaleup Scoreboard (ESS) — European Commission, DG Research and Innovation, Choose Europe programme. SSI calculated across 36 indicators, 15 dimensions, 2020–2025 data. Sources: Dealroom, InvestEurope, Eurostat, EPO, EIC surveys. Interactive tool: projects.research-and-innovation.ec.europa.eu
TechIreland Irish Startup Funding Review 2026 — TechIreland, supported by Enterprise Ireland. Dealroom data, tech companies operating on the island of Ireland, excluding undisclosed rounds. techireland.org
Panorama de l'écosystème French Tech 2025 — Mission French Tech, French Republic. Motherbase data (18,000 active startups), Mission French Tech monitoring. Employment data: sample of 14,455 startups at H1 2025. Investment data: January–September 2025 (source: France Digitale × EY Barometer). lafrenchtech.gouv.fr
EY Barometer of Venture Capital in France — Annual Review 2025 — EY France. Equity financing operations, 1 January to 31 December 2025. Sources: CF News, Dealroom.co, eCap, Maddyness. ey.com/fr_fr